Toronto Homeless Shelters [Data Visualization]
By Oliver C. Stringham in data-visualization tidy-tuesday r gis
January 12, 2020
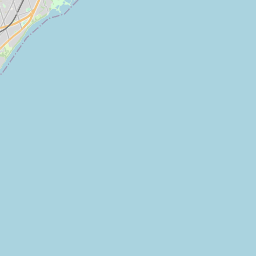
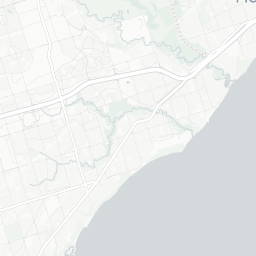
The #TidyTuesday data of the week come from #OpenDataToronto on homeless shelters in Toronto and their occupancy from 2017 - 2019. I took a try at web map with help from #rstats and Leafletjs.
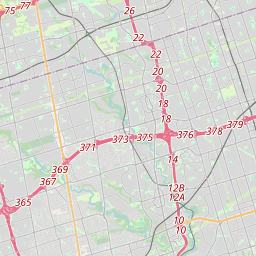
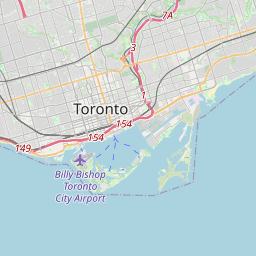
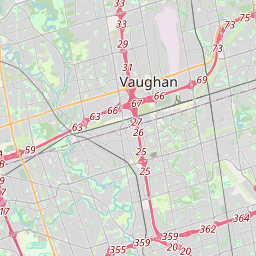
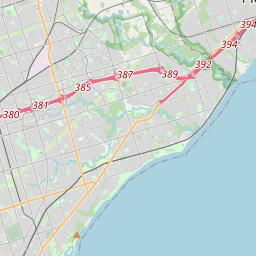
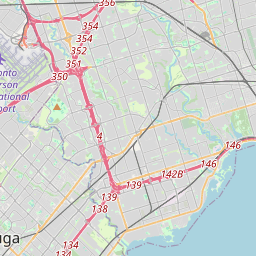


Weekly
Average
Occupancy
0 – 2,0002,000 – 4,000
4,000 – 6,000
6,000 – 8,000