Toronto Homeless Shelters [Data Visualization]
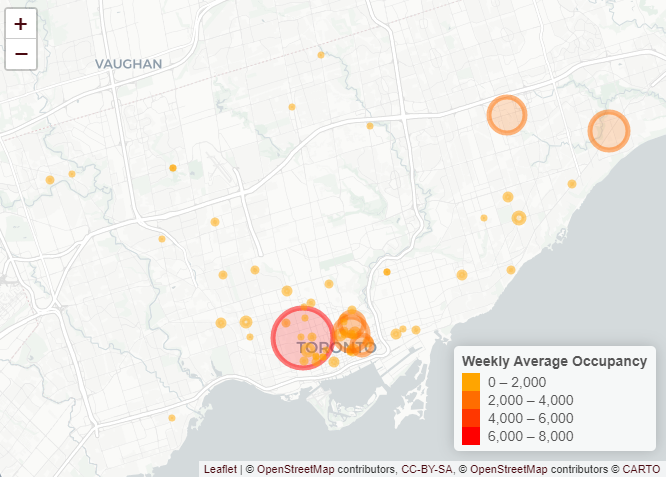
The #TidyTuesday data of the week come from #OpenDataToronto on homeless shelters in Toronto and their occupancy from 2017 - 2019. I took a try at web map with help from #rstats and Leafletjs.
Featuring data science tutorials, modelling, and visualization.
Written by Oliver C. Stringham
The #TidyTuesday data of the week come from #OpenDataToronto on homeless shelters in Toronto and their occupancy from 2017 - 2019. I took a try at web map with help from #rstats and Leafletjs.
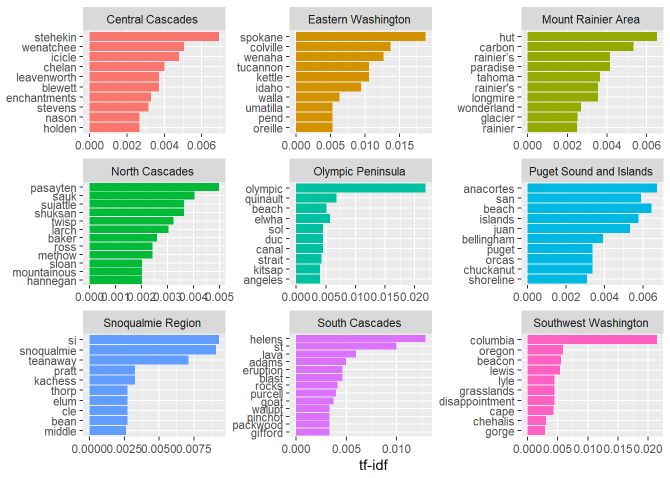
#TidyTuesday of the week for Washington Hiking data from @ WTA_hikers. You’re looking at the most common words used to describe parks in each region of WA (word clouds) and the most unique words used to describe each region (tf-idf). View code here.